Scrolling and Scaling Charts
Charts help illustrate how data behaves over time. When the charts are initially rendered, a best estimate is
made as to their scrolling position and scale. Controls are provided to change these as needed.
-
To scale horizontally, place the mouse pointer inside the charted data and use the mouse's scroll wheel.
Scaling will be centered at the mouse's position.
-
To scroll horizontally, place the mouse pointer inside the charted data and use the mouse's scroll wheel.
-
To scale vertically, place the mouse pointer inside the Vertical Adjust Area to the right of the chart and
use the mouse's scroll wheel. Scaling will be centered at the mouse's position.
-
To scroll vertically, place the mouse pointer inside the Vertical Adjust Area to the right of the chart and
drag the mouse vertically.
-
The Reset button under the Vertical Adjust Area will set the vertical parameters back to their
initial values.
-
The Show All button under the Vertical Adjust Area will set vertical parameters so that the full
range of vertical values are shown. This can be used to show outliers or expand a set of similar values.
-
Reloading the page will reset all charts to the original view.
This quick chart help feature
 Help
is shown near charts. Hovering over it will show the following:
Help
is shown near charts. Hovering over it will show the following:
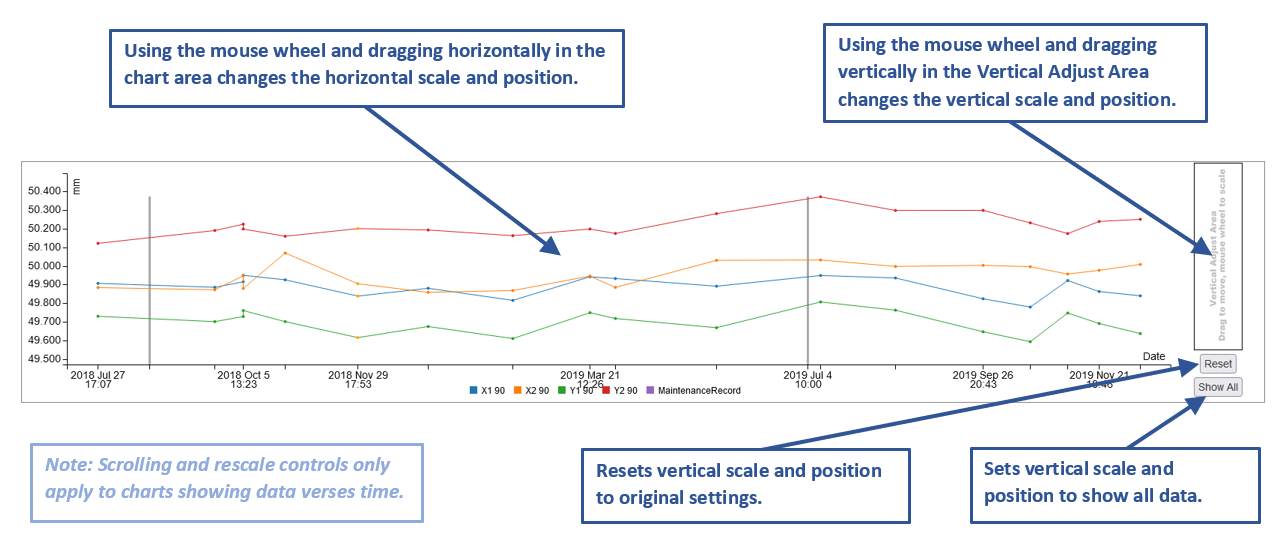
Note that these features only apply to charts that are plotted as data verses time.
There is also a known problem where, when the chart is zoomed in horizontally, changing vertical settings will
contract the data horizontally. A workaround is to scroll the data slightly horizontally to restore the
horizontal settings.